Unemployment Stories
Ascham Grindal – Commentary on the Latest ONS Labour Market Release
The latest ONS labour market statistics have prompted a flurry of commentary—some strong, some less so. What follows is our perspective at Ascham Grindal, where we see the overall trend returning to what could be considered ‘normal’. What we mean is that the combination of factors that had driven the labour market previously including the impact of the pandemic have been unwound, and the effect of both increased participation (through declines in inactivity) as well as increased costs due to changes in payroll taxation and minimum wages are feeding through to ‘correct’ the labour market. To avoid repeating what other commentators have already covered, we focus on two elements:
unemployment trends over different time horizons, and
the amount of time individuals spend unemployed.
Unemployment: Swings and Cycles
Our starting point is simple: unemployment is not a measure that should sit at one “correct” level. While we may prefer it to be as low as possible, unemployment is inherently cyclical. It reflects people moving in and out of work for a wide range of reasons—shifts in business needs, individual performance, personal circumstances, or simply bad luck. This runs counter to the instinctive view that rising unemployment signals that something is “wrong”. The reality is more nuanced and the challenge remains keeping an eye on the nuances whilst being able to look for any broader trends. To start with, we will take a long-term view of unemployment.
The chart below shows the unemployment rate since March 1992:
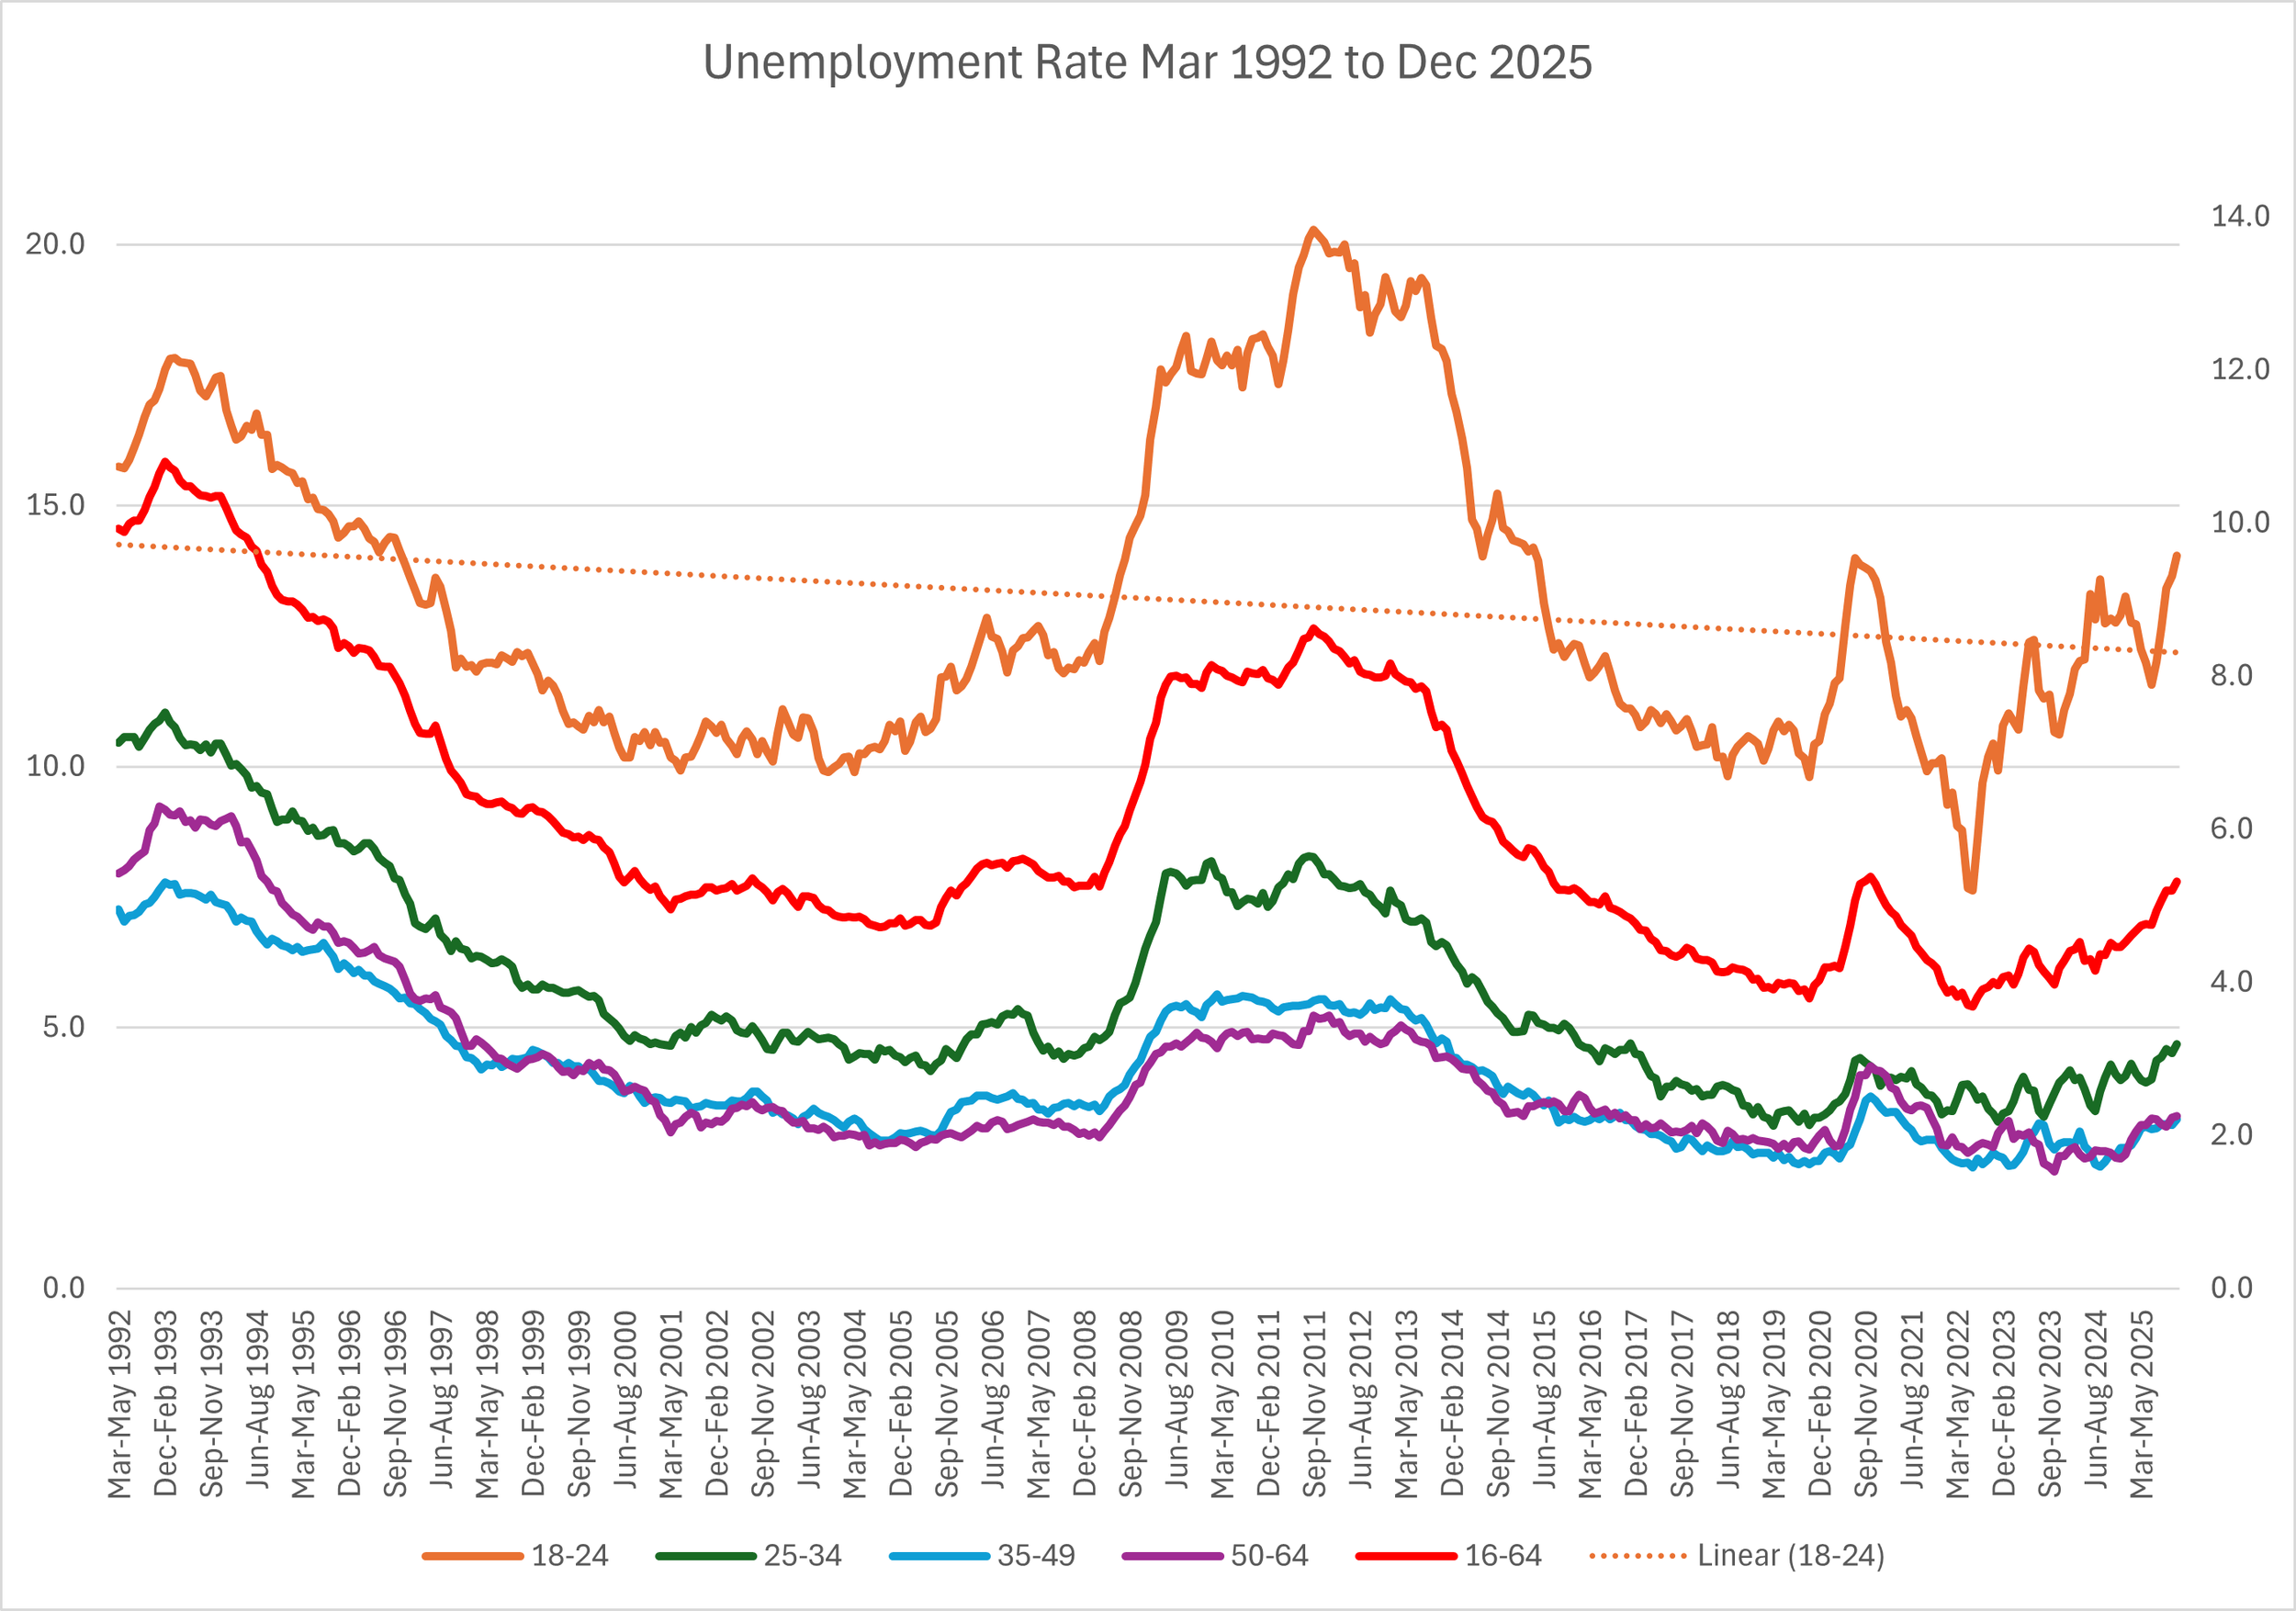
ONS data of Unemployment rate from 1992 to Dec 2025
The left-hand axis shows unemployment rates for the 18–24, 25–34, 35–49 and 50–64 age groups, while the right-hand axis shows the overall 16–64 rate (in red). A few key points stand out:
18–24-year-olds consistently experience higher unemployment rates than the rest of the working-age population, but the pattern closely tracks the overall cycle.
The steepness of the rise in youth unemployment is also more pronounced than for other age groups, so a sudden ‘surge’ is to be expected when the economy is slowing.
This does not mean youth unemployment is unimportant, but it does caution against short-term policy overreaction. What matters is whether the long‑run trend for young people is worsening compared to the overall trend.
Looking at data from November 2017 to December 2025:
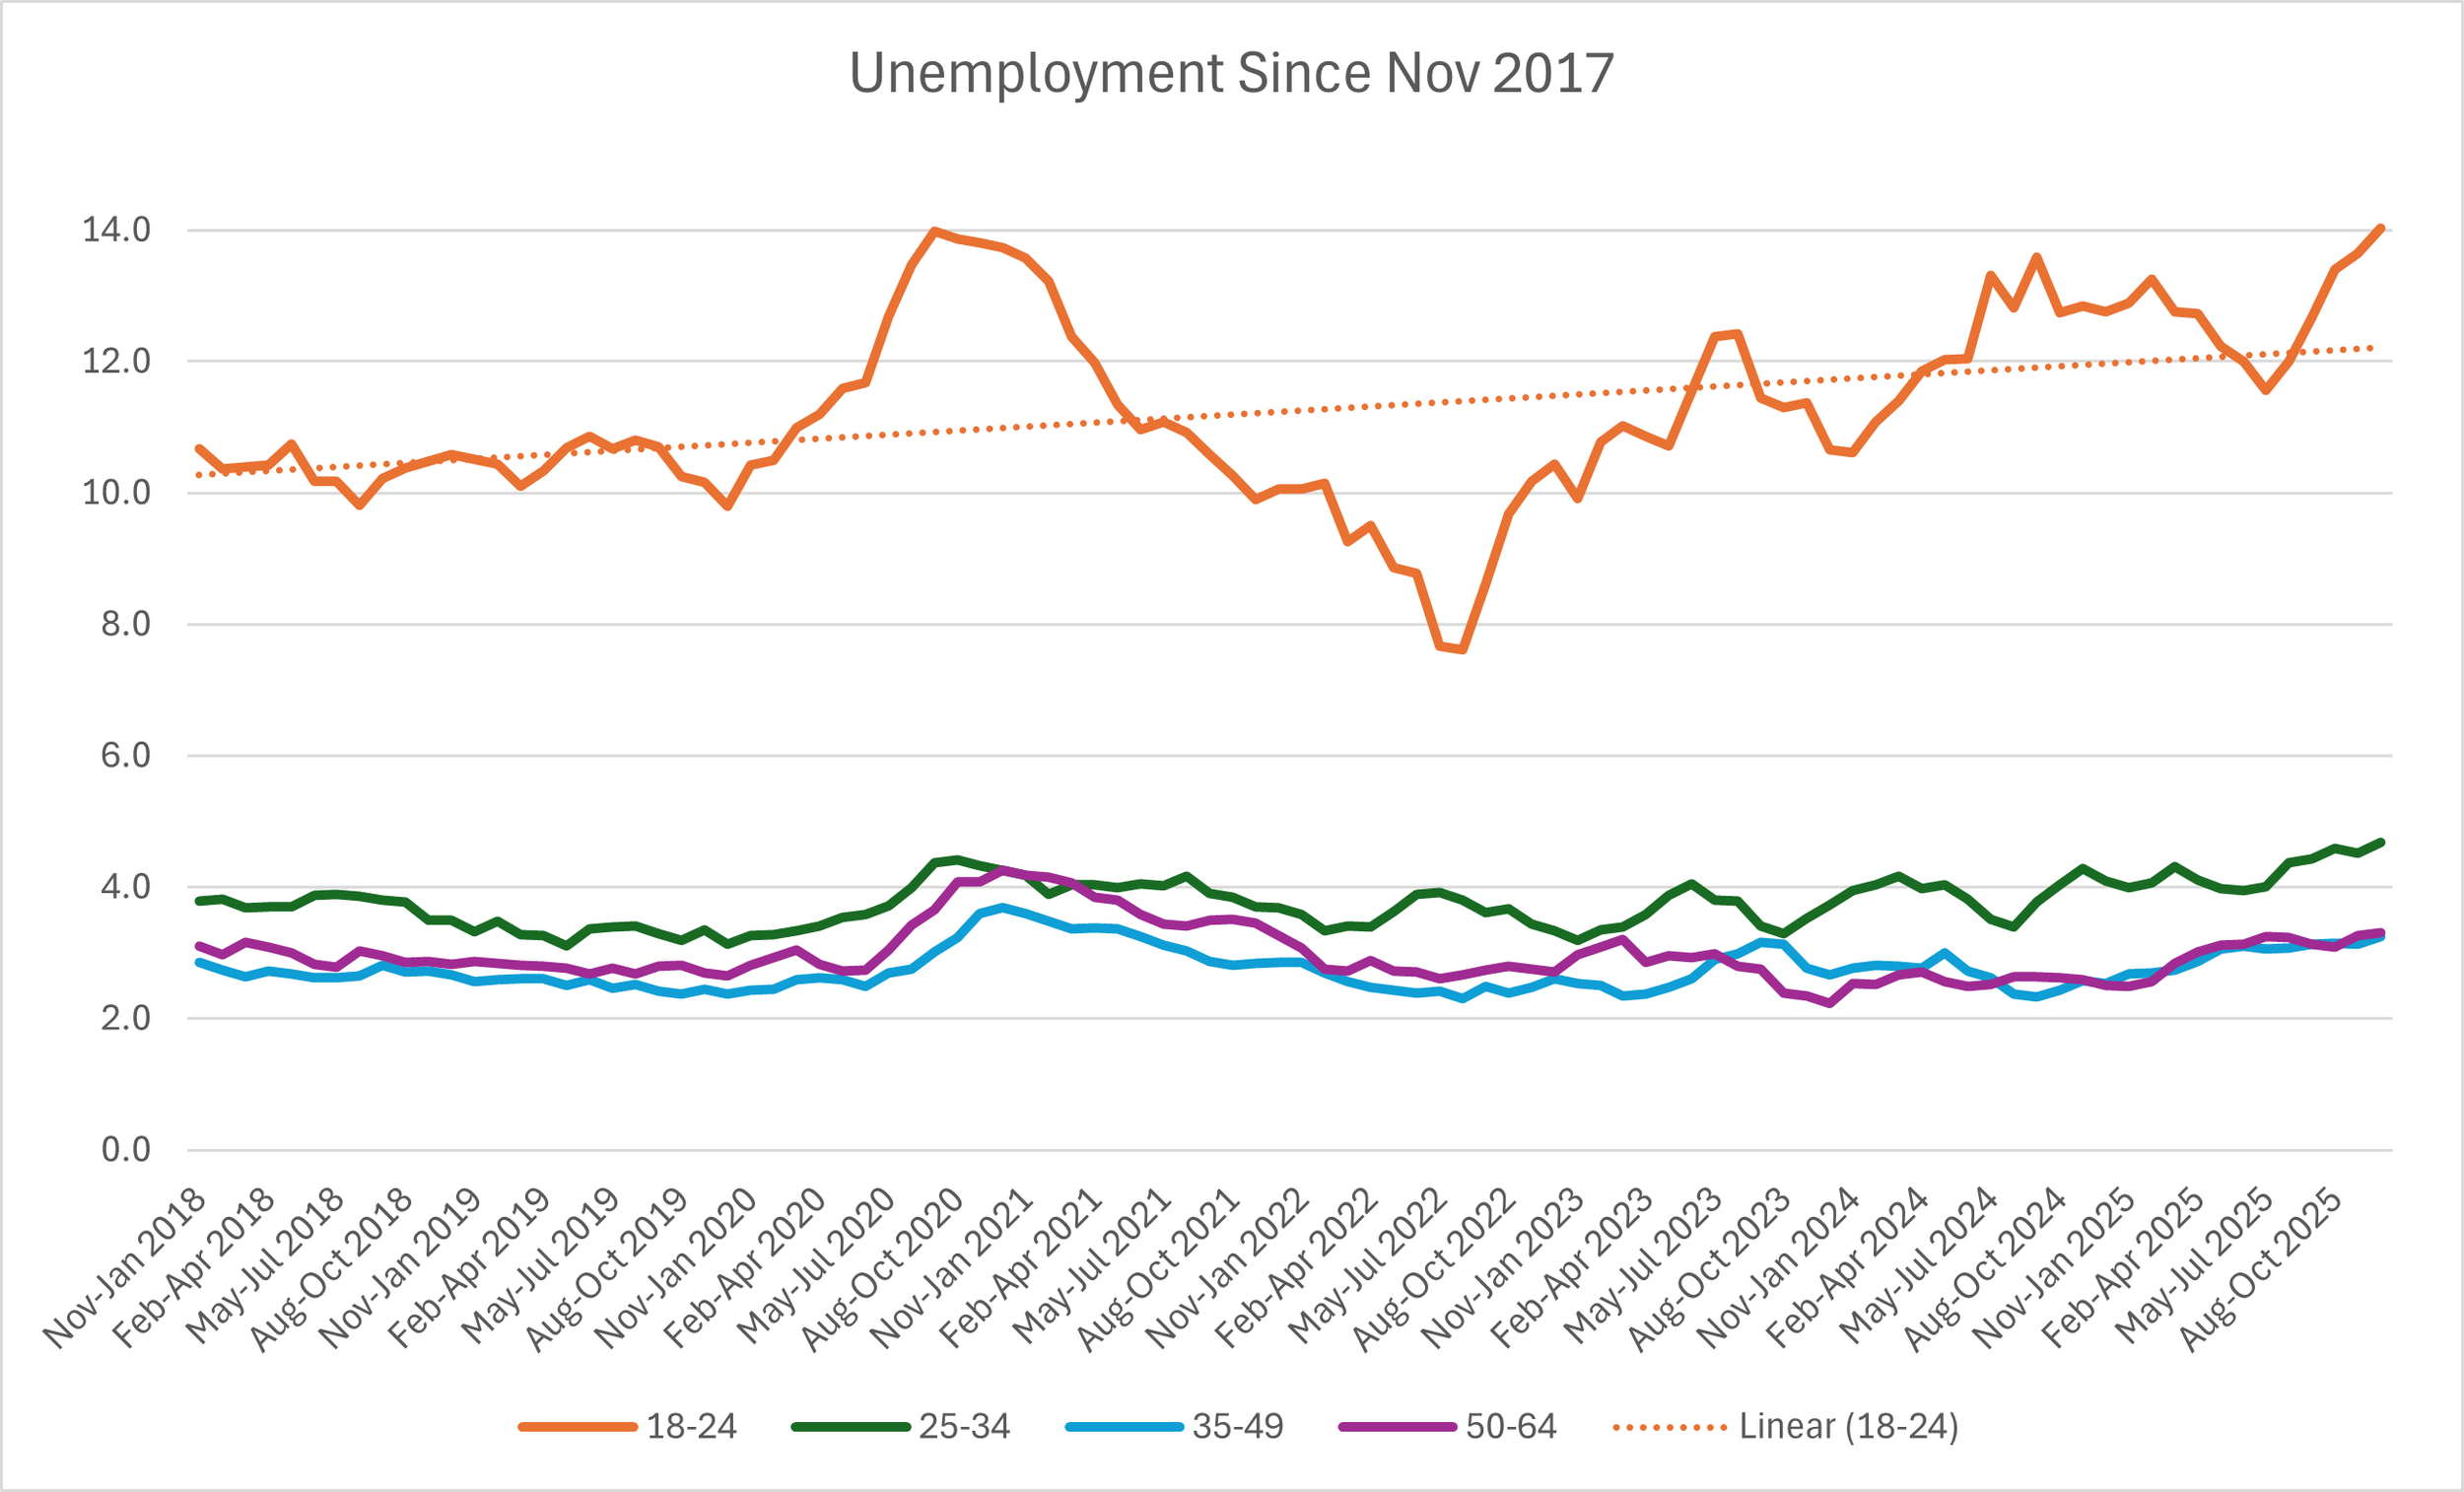
The 18–24 rate appears not only higher but also trending upward. This may be driven by:
recent changes to National Insurance contributions (NICs) and increases in minimum wage levels,
shifting employer cost incentives affecting younger workers,
early signs of AI and technological restructuring, or
a softening labour market where younger workers are typically affected first.
However, unless the unemployment rate for 18–24s rises beyond around 14%, much of this remains likely to be cyclical. If unemployment rises across older age groups, this interpretation will be reinforced. While we do not overlook the personal impact of unemployment, understanding underlying drivers is critical to avoid reactive, resource‑intensive policy measures with limited effect.
Where intervention is warranted, strengthening unemployment benefits and enabling local authorities to use partnerships established through the Get Britain Working framework may be more effective than short‑term labour‑market tinkering.
Beyond the Rate: Focus on Duration
Although unemployment rates matter, they offer a limited picture. Unemployment is part of normal labour‑market functioning, capturing people between jobs, taking short breaks, or facing longer-term barriers. What we should focus on more closely is how long individuals remain unemployed. The longer someone is out of work, the greater the risk of scarring to their earning potential and employment prospects. Looking at the proportion of unemployed individuals out of work for more than 12 months in the LFS data from 1992 to Dec 2025:
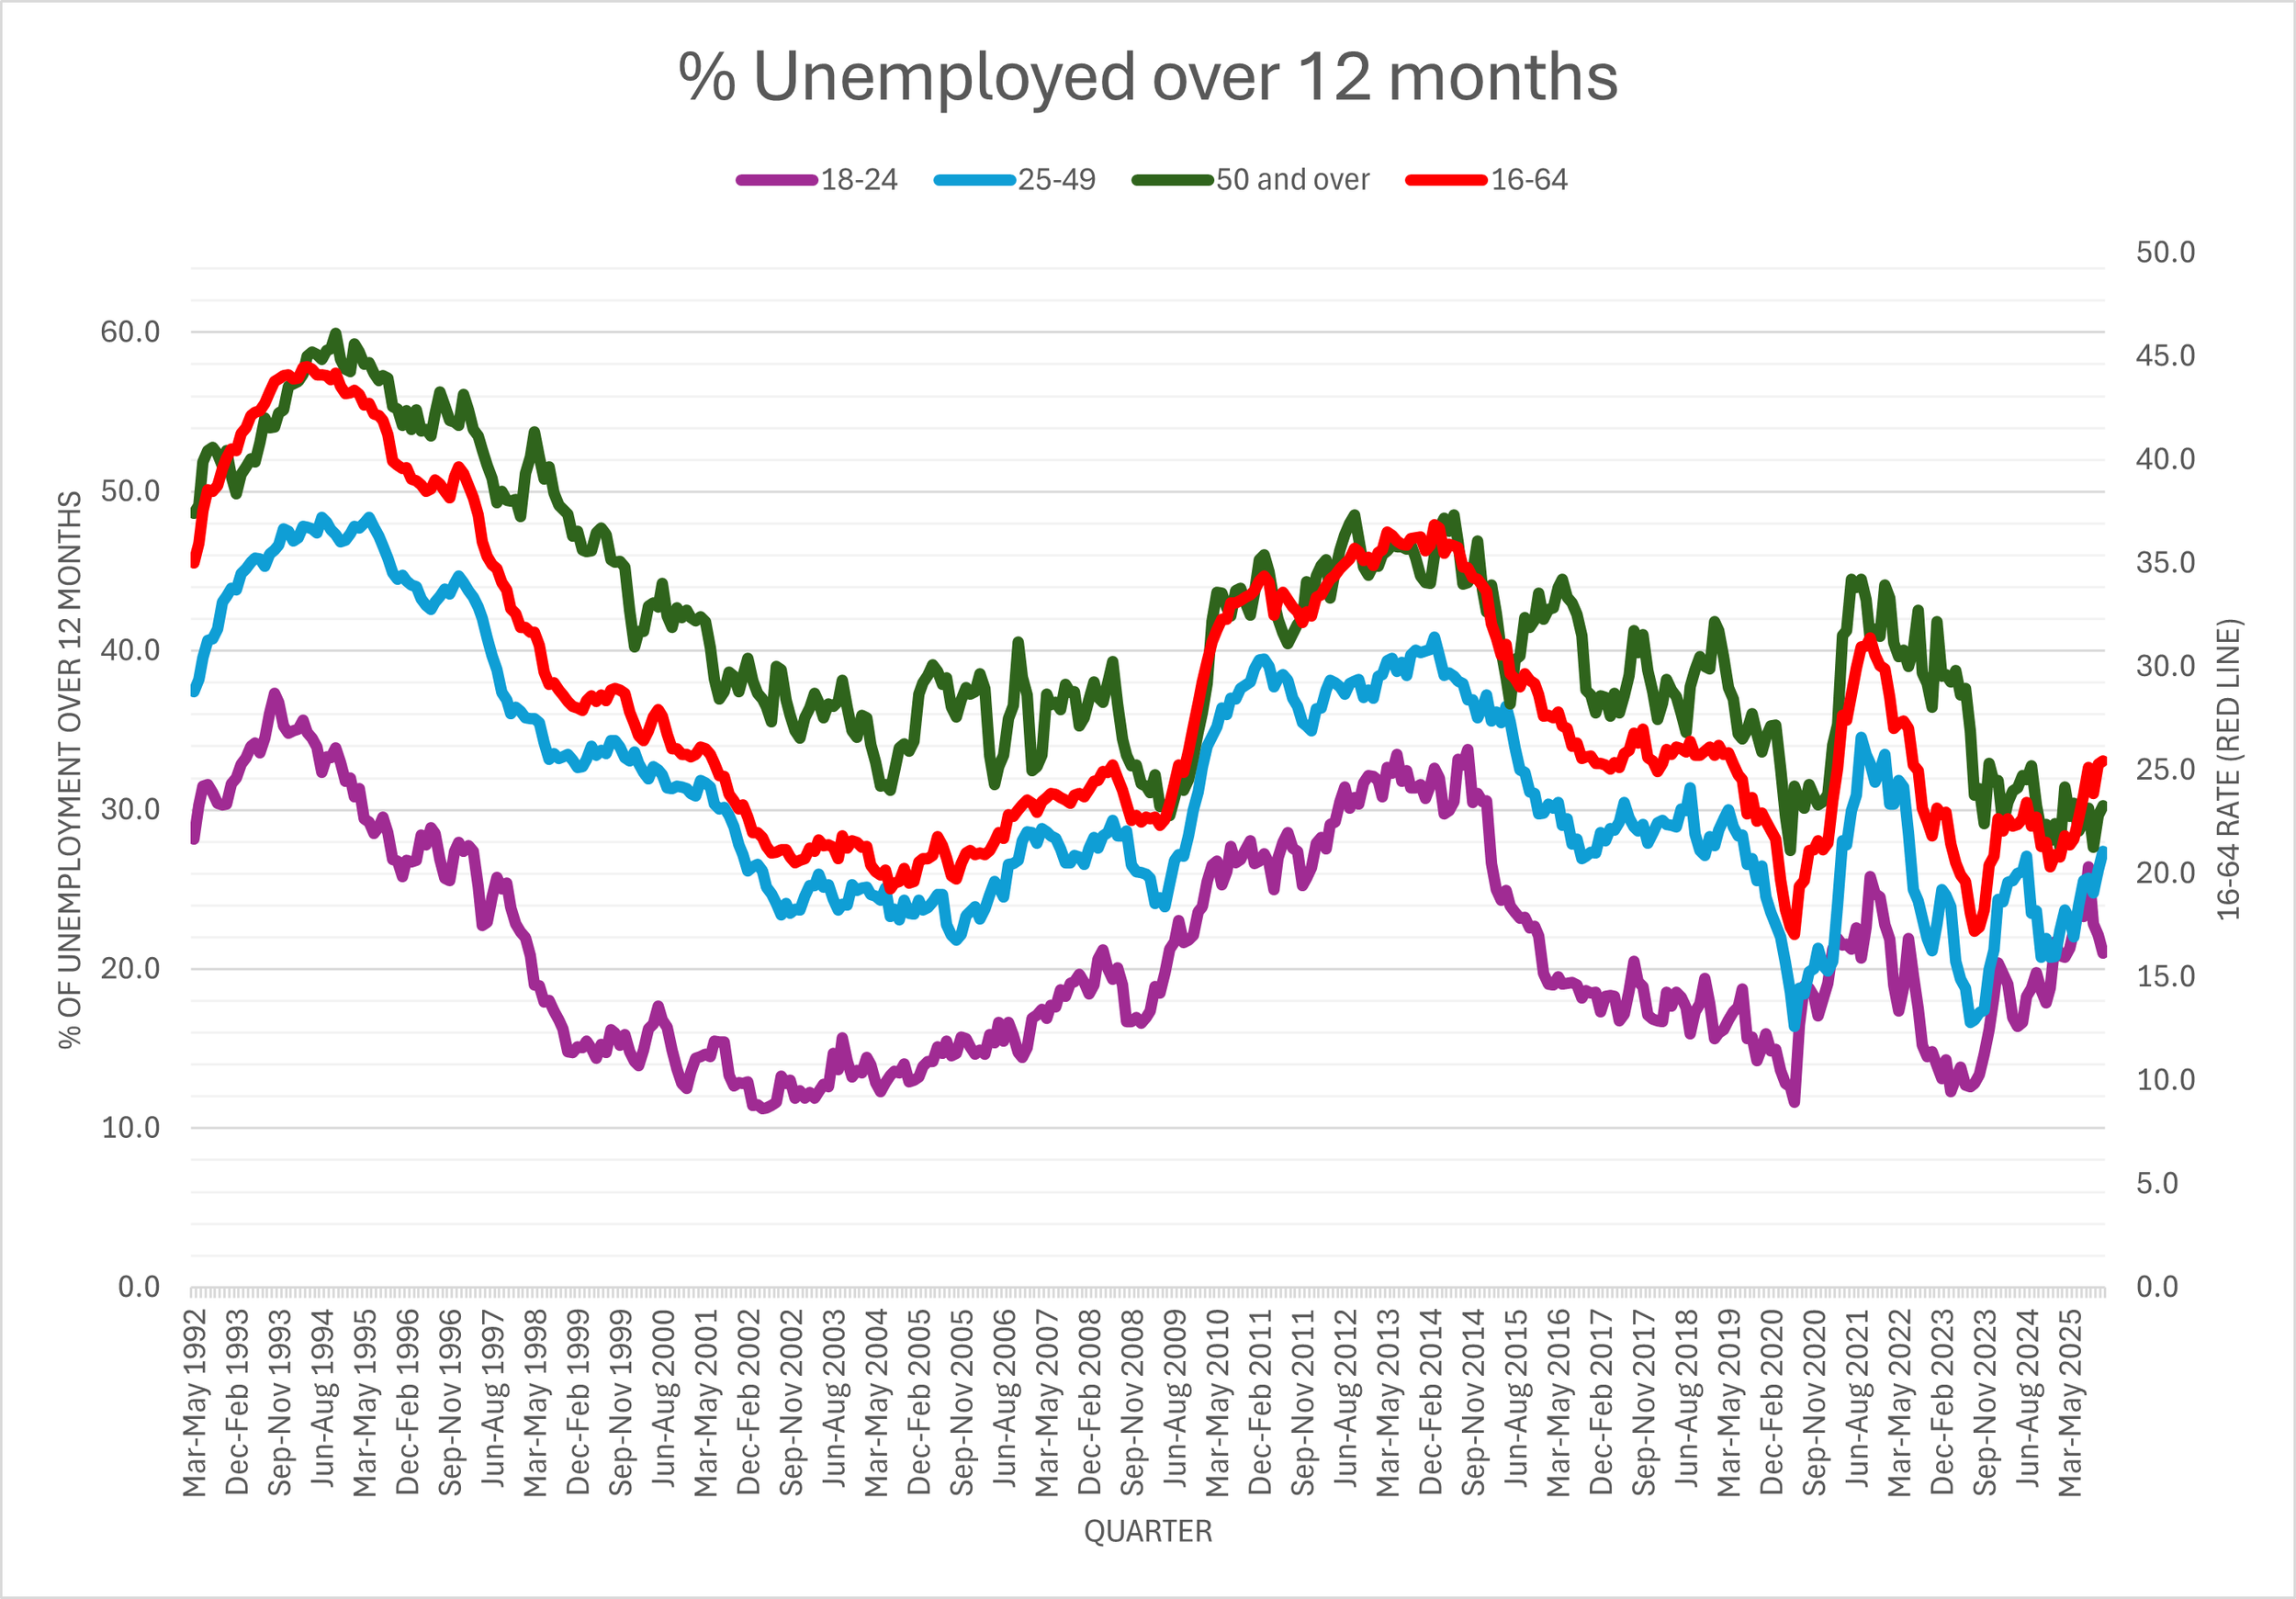
Key insights include:
18–24-year‑olds are less likely than older groups to be unemployed for over 12 months.
The trends remain broadly cyclical, rising during weaker economic conditions.
Overall long‑term unemployment is significantly lower today than in the early 1990s.
Currently, around 25% of the unemployed have been out of work for more than 12 months. This still means most people find employment within a year. For 18–24s, the current rate of 21% is elevated compared to 16% in April–June, but this may reflect further evidence of NICs changes increasing hiring costs for young workers. It could also indicate a competition effect from falling inactivity rates meaning more people competing for jobs, or simply the economy is slowing. It is unlikely that the data will simply tell us which of these factors are in play but we can take a more recent view and look at the trends since Jan 2019. The following chart does this:
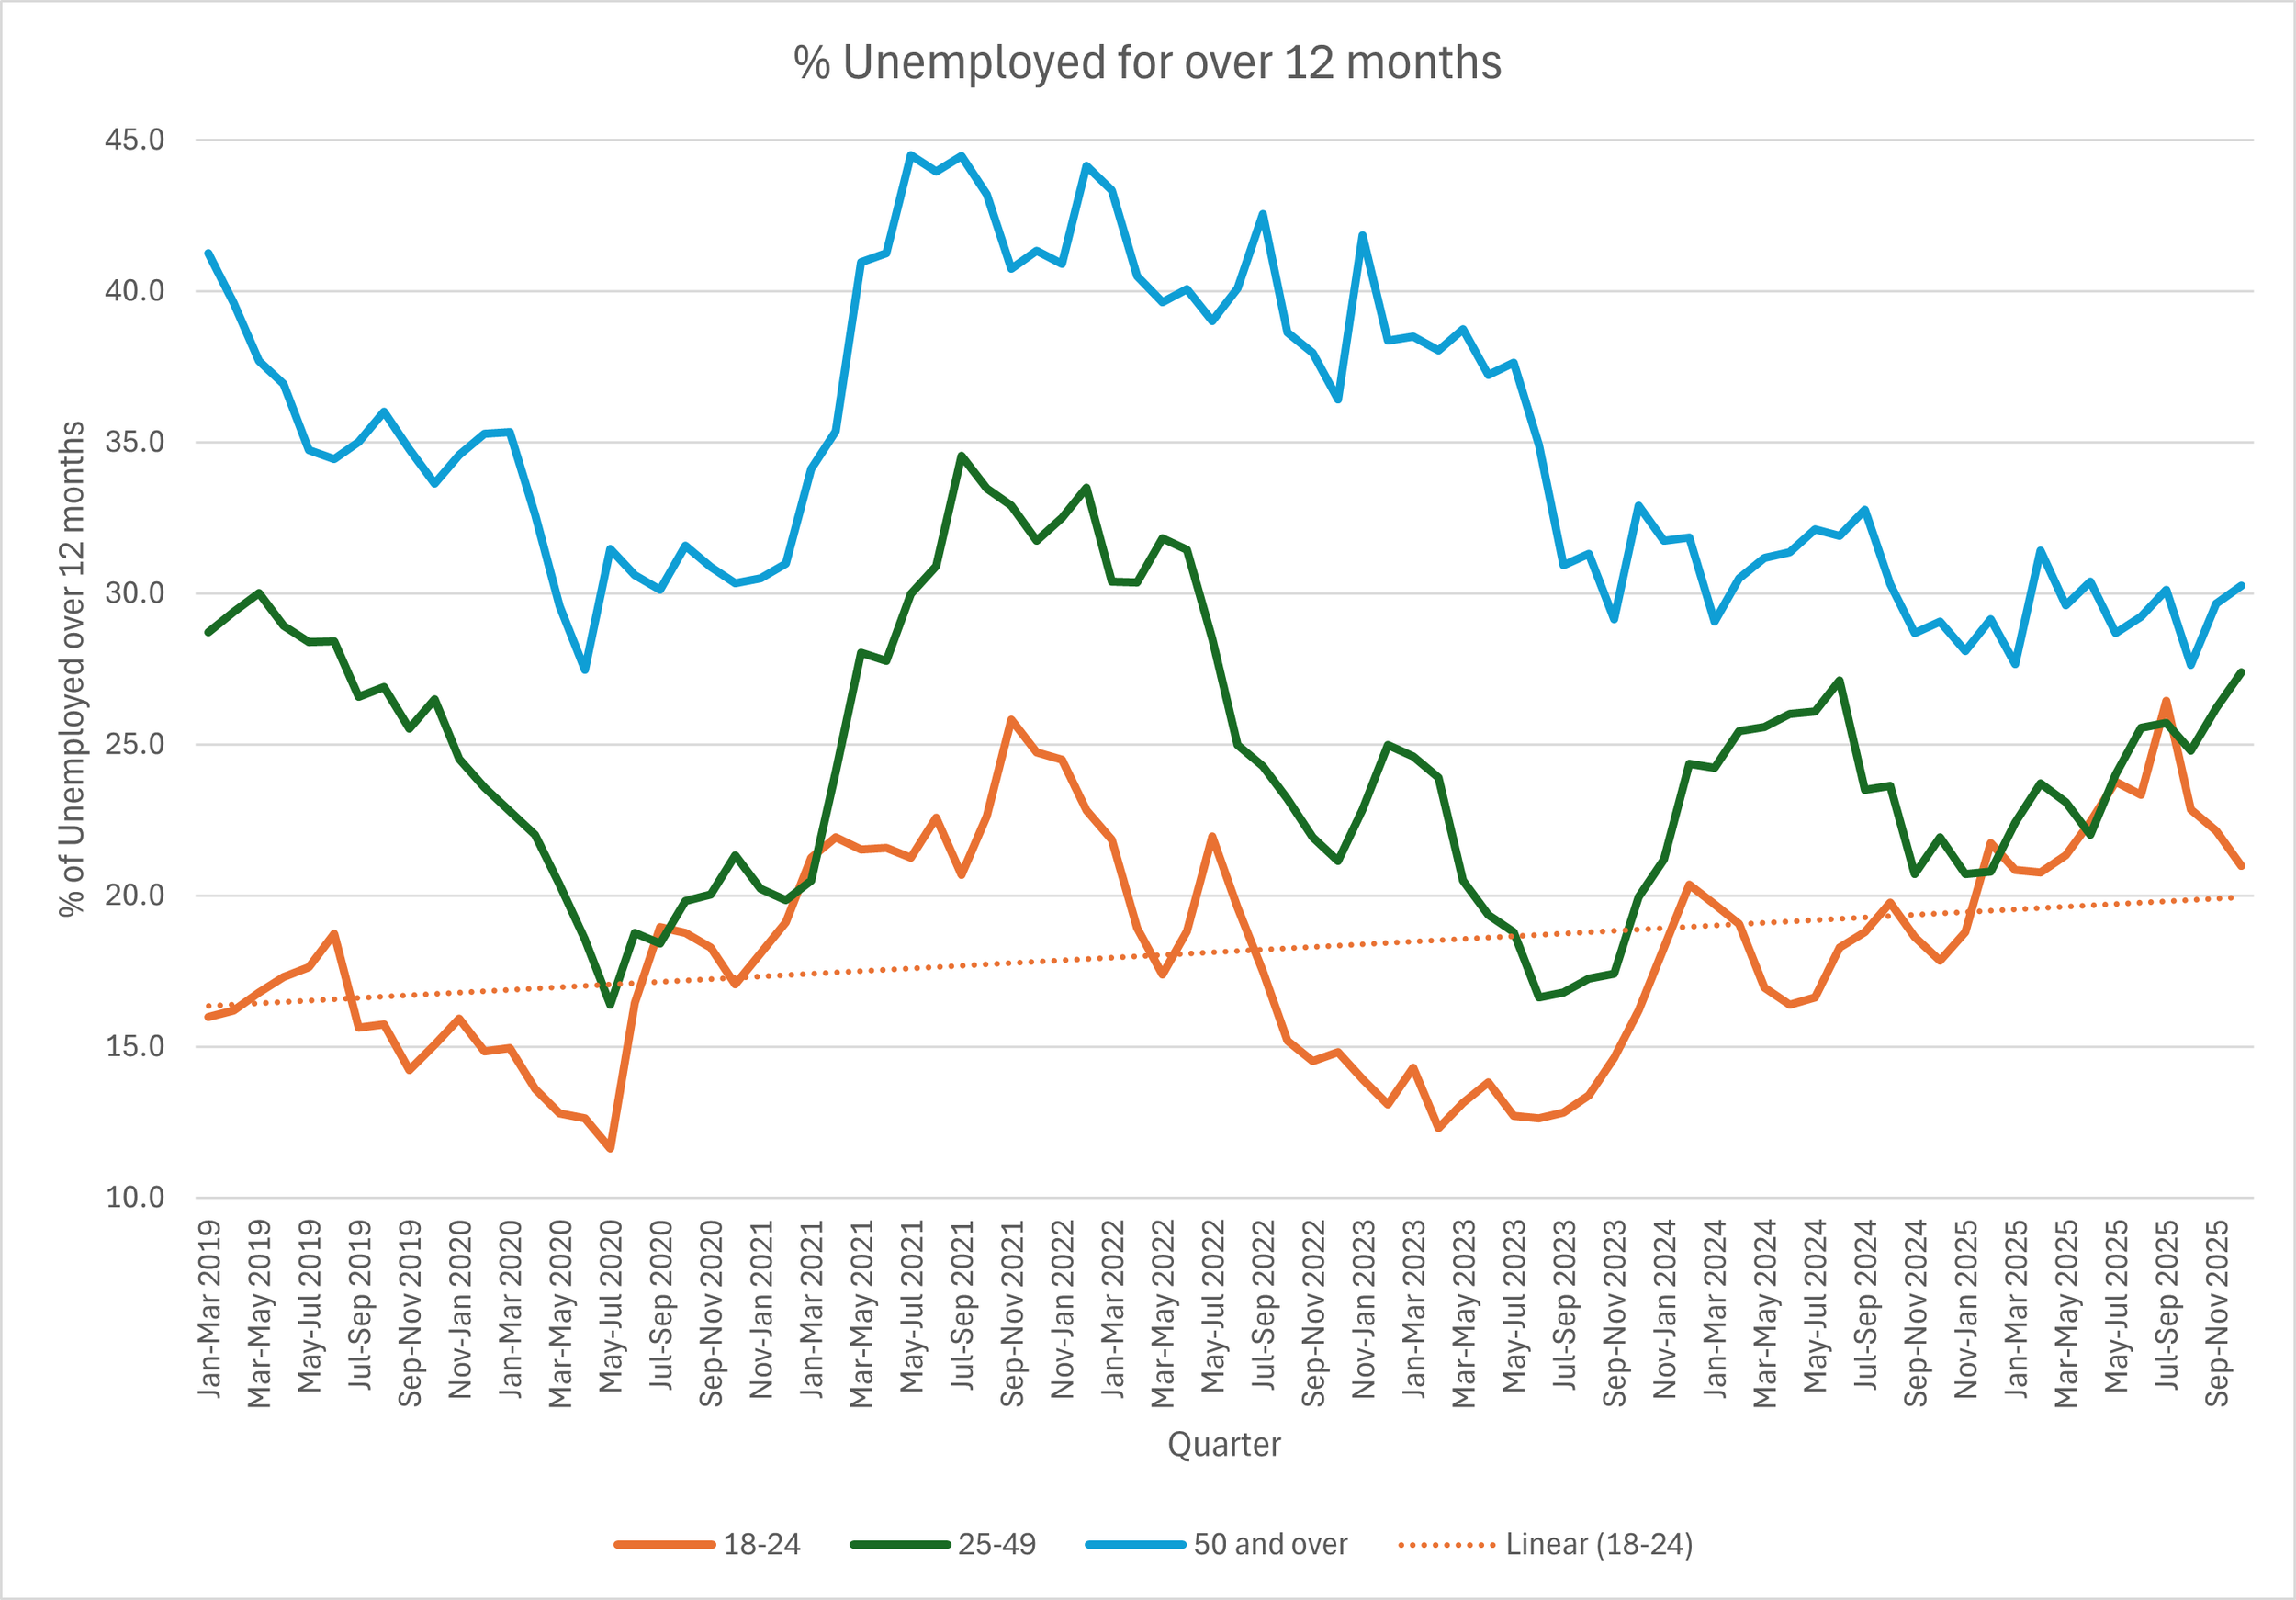
The first observation is that overall older workers (50 plus) have a much higher risk of being unemployed for more than 12 months. Although this figure has declined since the pandemic and has converged with the prime age working group 25-49. Depending on how this plays out over the next quarter, this may be an indicator of a more pronounced set of challenges, although decomposing the numbers to look at specific sectors or cohorts will be requried. For younger workers the trend since 2019, shows that long‑term unemployment trend has risen and recently converged with the 25–49 rate—a potentially concerning development requiring further analysis.
However, the majority of young people continue to find work within six months:
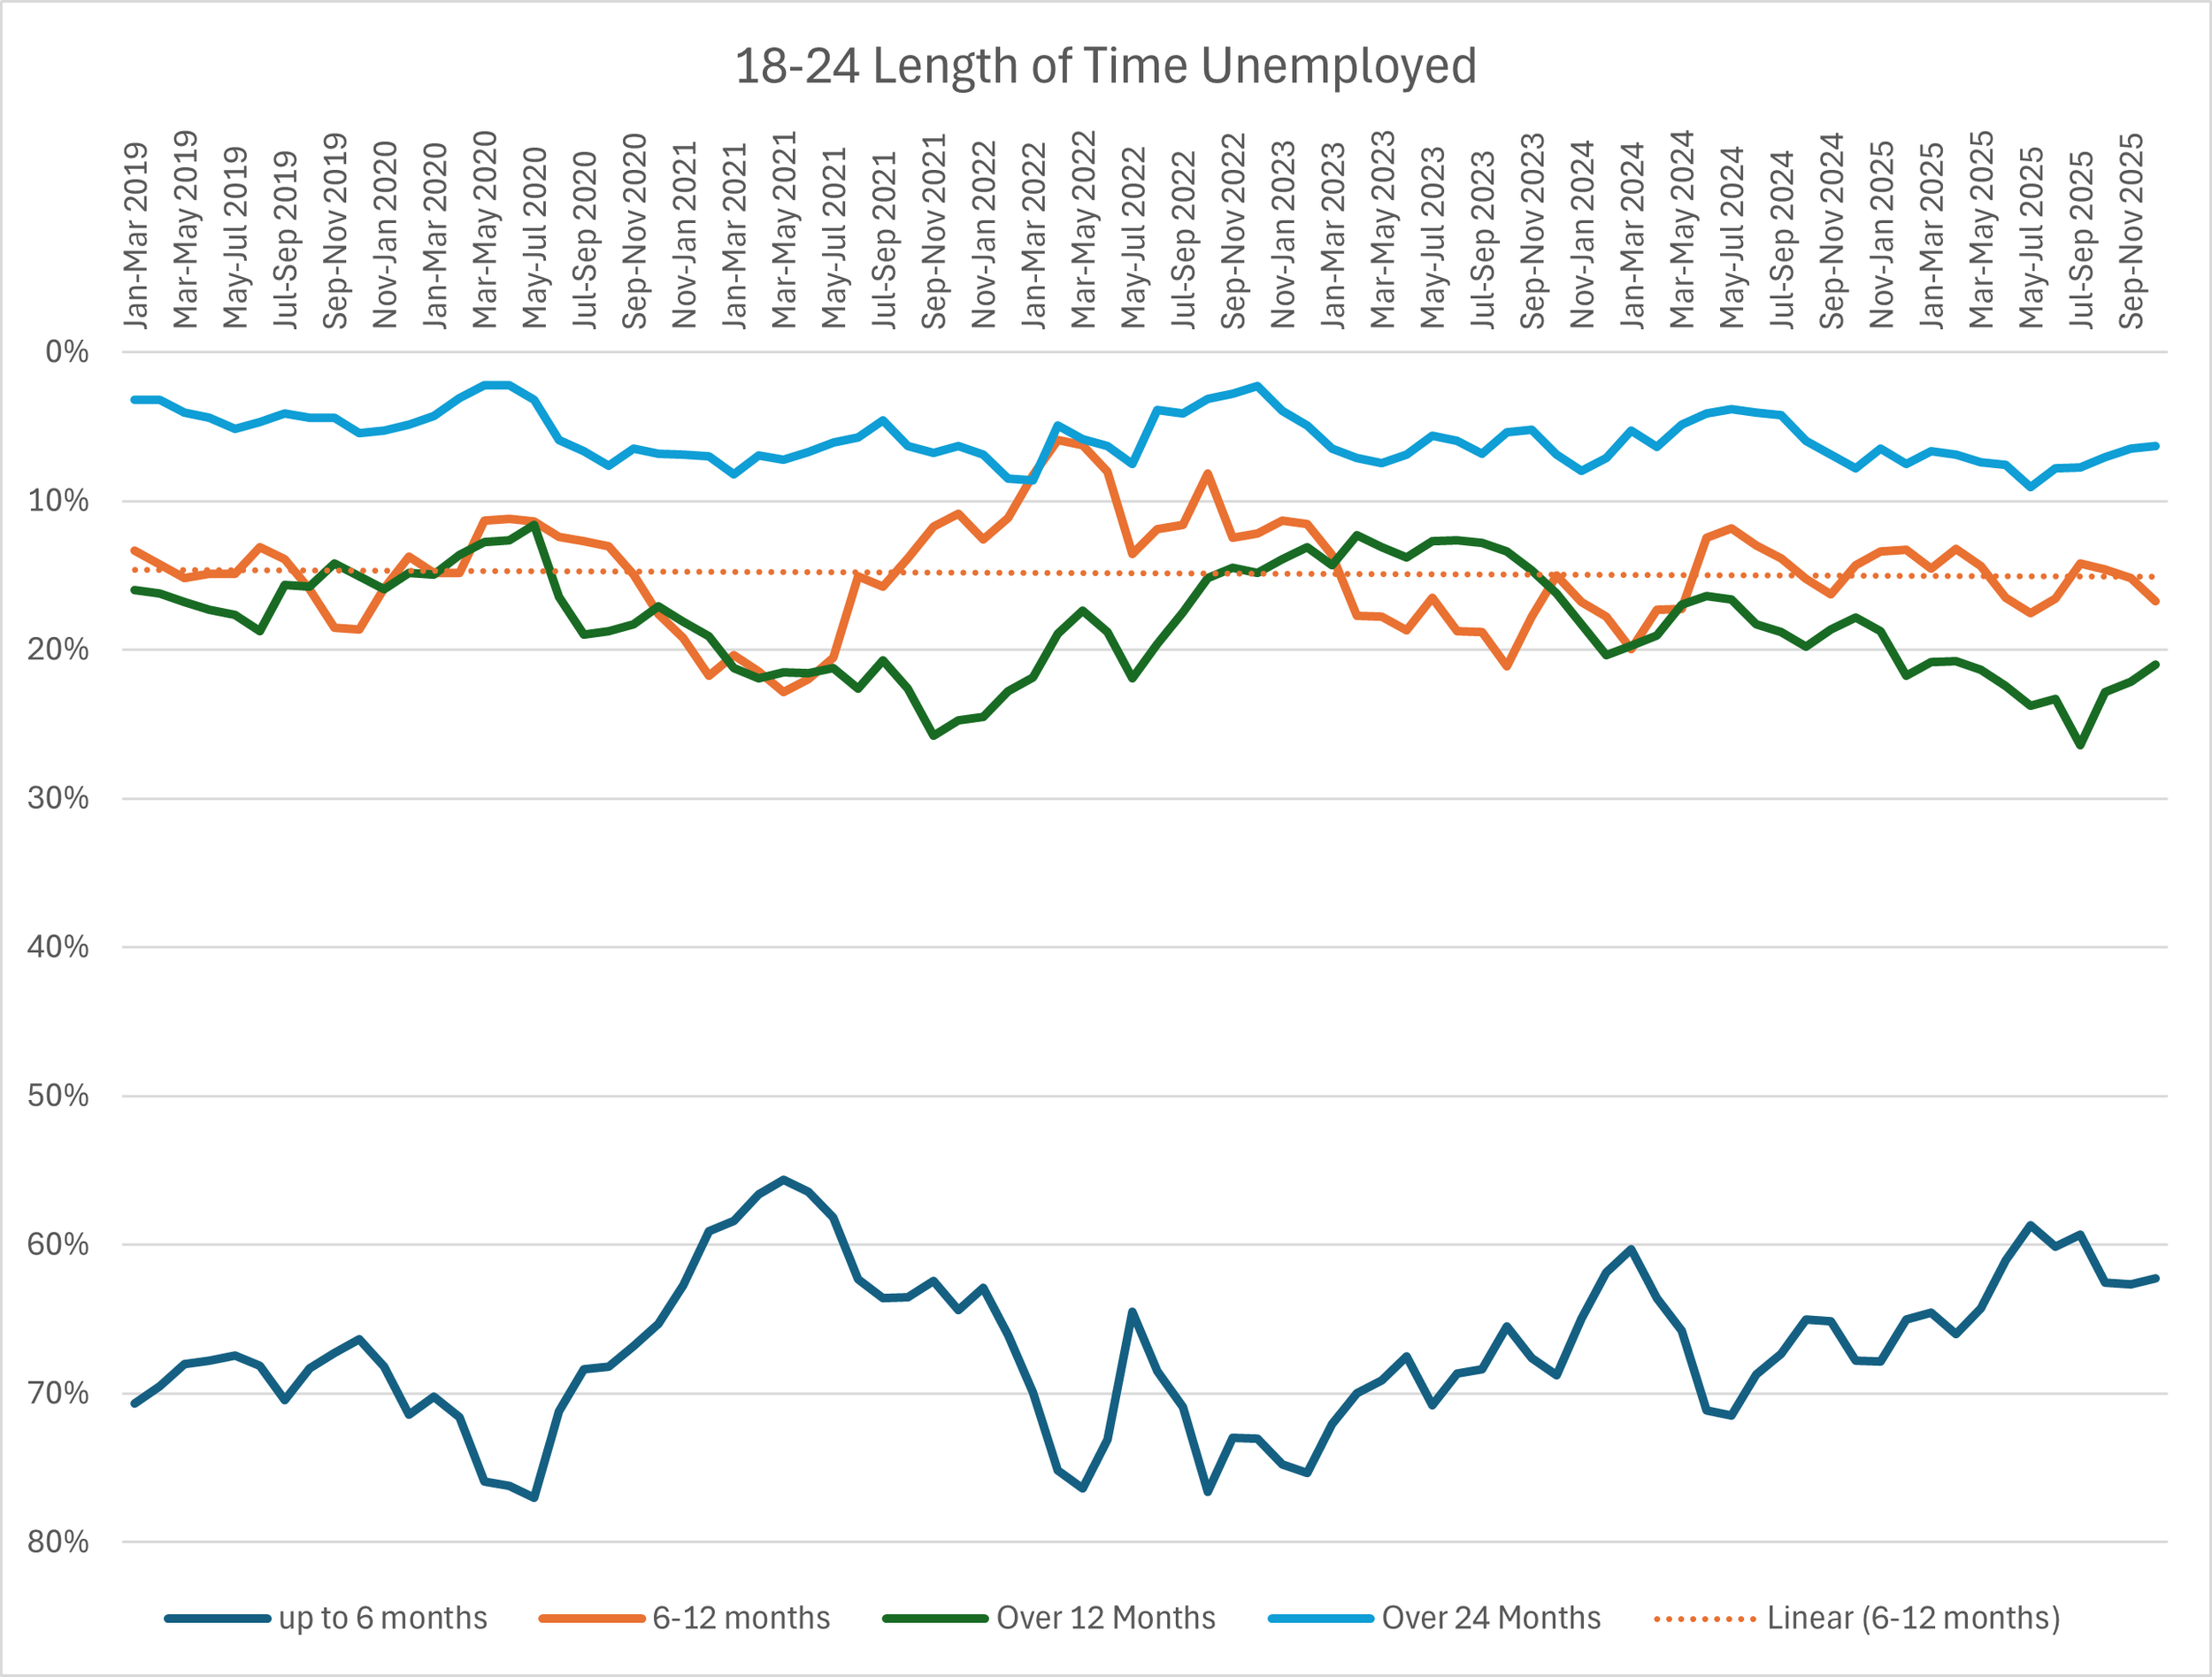
While the “up to 6 months” share has fallen to around 60%, the shift has largely moved into the 6–12‑month category. Crucially, the proportion unemployed for over 24 months remains below 10%. A sustained fall in the six‑month rate would be a more serious signal of deepening structural challenges. In terms of the ‘AI is killing the entry level’ debate, we would expect that an ongoing decline in the ‘up to 6 months’ as well as increases in both 6-12 months and over 12 months rates would become much more pronounced in the data, suggesting that 18-24 year olds are unable to access job opportunities even those at a lower level of wage or opportunity. We would also need to see increases in inactivity rates for 18-24 either reflecting a ‘crowding out effect’ as more skilled peers take jobs that lower-skilled 18-24s cannot access. There may well also be other indicators such as sudden expansions in the number of 18-24 who are considered ‘self-employed’.
Overall, the AI wave will need to be divined from various labour market indicators but so far, based on the unemployment rate, the trends do not indicate a sudden decline in entry level opportunities. But it does need monitoring.
What the Data Doesn’t Show
None of the charts capture the human cost of unemployment.
Long periods without work can have significant impacts on mental health, wellbeing and financial stability. Nor do the data address whether the jobs people return to offer adequate pay, hours, or career progression. These remain essential considerations for policymakers, investors, and local leaders aiming to ensure labour markets support a thriving, resilient economy.
But beyond the headline rates, and detailed analysis - the overall trends and length of time people are spending unemployed remain a critical element of avoiding simply reacting to the rate of unemployment. Yes it is difficult out there for many - but we need to understand why.
All charts are derived from ONS Labour Force Survey data (17 February 2026). Analysis and chart production by Ascham Grindal Ltd. Any errors are our own. This article is for promotional purposes only and is not intended for investment or strategic decision-making.