Stocks & Flows: What’s Behind Rising Unemployment
Public commentary on the UK labour market often veers toward dramatic headlines about the “end of the economy” whenever the unemployment rate ticks upward. But for those of us who spend an inordinate amount of time with the Labour Force Survey (LFS), for all its flaws, a different picture usually emerges.
So if you came for another explosive prediction that unemployment will hit x%, you may be in the wrong place.
Yes, unemployment will likely rise to around 5.5%, perhaps even 6%. This will be difficult for those directly affected, and it will weigh on confidence. If it coincides with local elections, the political temperature will undoubtedly rise as well. But the underlying reality is both more mundane and more nuanced. Unemployment is increasing because the economy is slowing, workplace tax changes are feeding through, and because more people who were previously economically inactive have returned to the labour market and cannot immediately find work.
This does not minimise the human impact of unemployment. Rather, it reflects the importance of analysing unemployment as part of a broader labour market system—one involving stocks (levels) and flows (movements) of people between employment, unemployment, and inactivity.
Unemployment Is Normal — Even When It Rises
High unemployment is destructive, but unemployment itself is a normal feature of a functioning labour market. The numbers in the LFS are fundamentally an accounting exercise designed to show who is currently out of work—even though most people move out of unemployment again within six months. Crucially, rising unemployment does not automatically signal that something fundamental has gone wrong:
It may simply indicate that firms are no longer hoarding labour.
Or that firms are struggling to keep operating.
Or that falling inactivity is leading to more people back into the labour force.
Or that wage pressures are easing, reshaping hiring behaviour as firms can be pickier.
In other words, the headline rate alone rarely tells the full story. In fact its likely across the UK and within various sectors some combination of these will be playing out.
Contextualising Today’s Labour Market
Using LFS data back to 1975, average pre‑pandemic unemployment rates sit around 5.8% for the 2001–2019 period. Since the pandemic the rates have been nearer to an average of 4.4%. Against that backdrop, today's figures look less unusual if we take the view that perhaps the labour market is correcting to reflect a final unwinding of the unusual circumstances that the pandemic reflected . This also may mean that we can be less certain that we are seeing the start of some AI-tsunami. The more important point, however, is: unemployment requires us to understand how the stock of unemployed people is affected by flows into and out of that group. Simply focusing on the total figure in the monthly labour market statistics is not going to improve policy intervnetions which are either going to be premature or too late to address the issue.
Why Labour Market Flows Matter
As cold as it sounds, unemployment is a snapshot of a constantly moving system—not a queue of people heading to a soup kitchen. That imagery only applies during genuine recessions or depressions. Although we definitely should not ignore unemployment, looking at the flows is a key part of understanding the stock of the problem. So if we are arguing that we should not rely solely on the unemployment figure what is alternative? Part of the answer comes from understanding the flow of people between:
employment → unemployment or inactivity
inactivity → unemployment or employment
unemployment → employment or inactivity
These changes make a lot of sense if we break them down. For example someone who retires from a job becomes inactive. Likewise if you stop work to take care of children or study you also become inactive. Inactivity does not automatically mean you become NEET or some other ‘problem’ designation. Likewise if you are a student (inactive) and you graduate you will start looking for work - if you are successful you are employed, if not you may eventually sign-on for Universal Credit.
To show this, we utilise a set of Labour Market Flow data which is collected by ONS as part of the LFS. Although they are technically experimental statistics they are incredibly useful for showing how the composition of employment/unemployment and inactivity changes over time. These flow data statistics are rarely discussed but in our opinion are crucial in interpreting current trends, they do not replace the value of the wider LFS but they are an important part that is so often overlooked.
What the Flow Charts Show
1. Long‑Term Flows
Our first chart shows long‑term flows from unemployment and inactivity into employment. It takes data from April 2012, through to the most recent data.
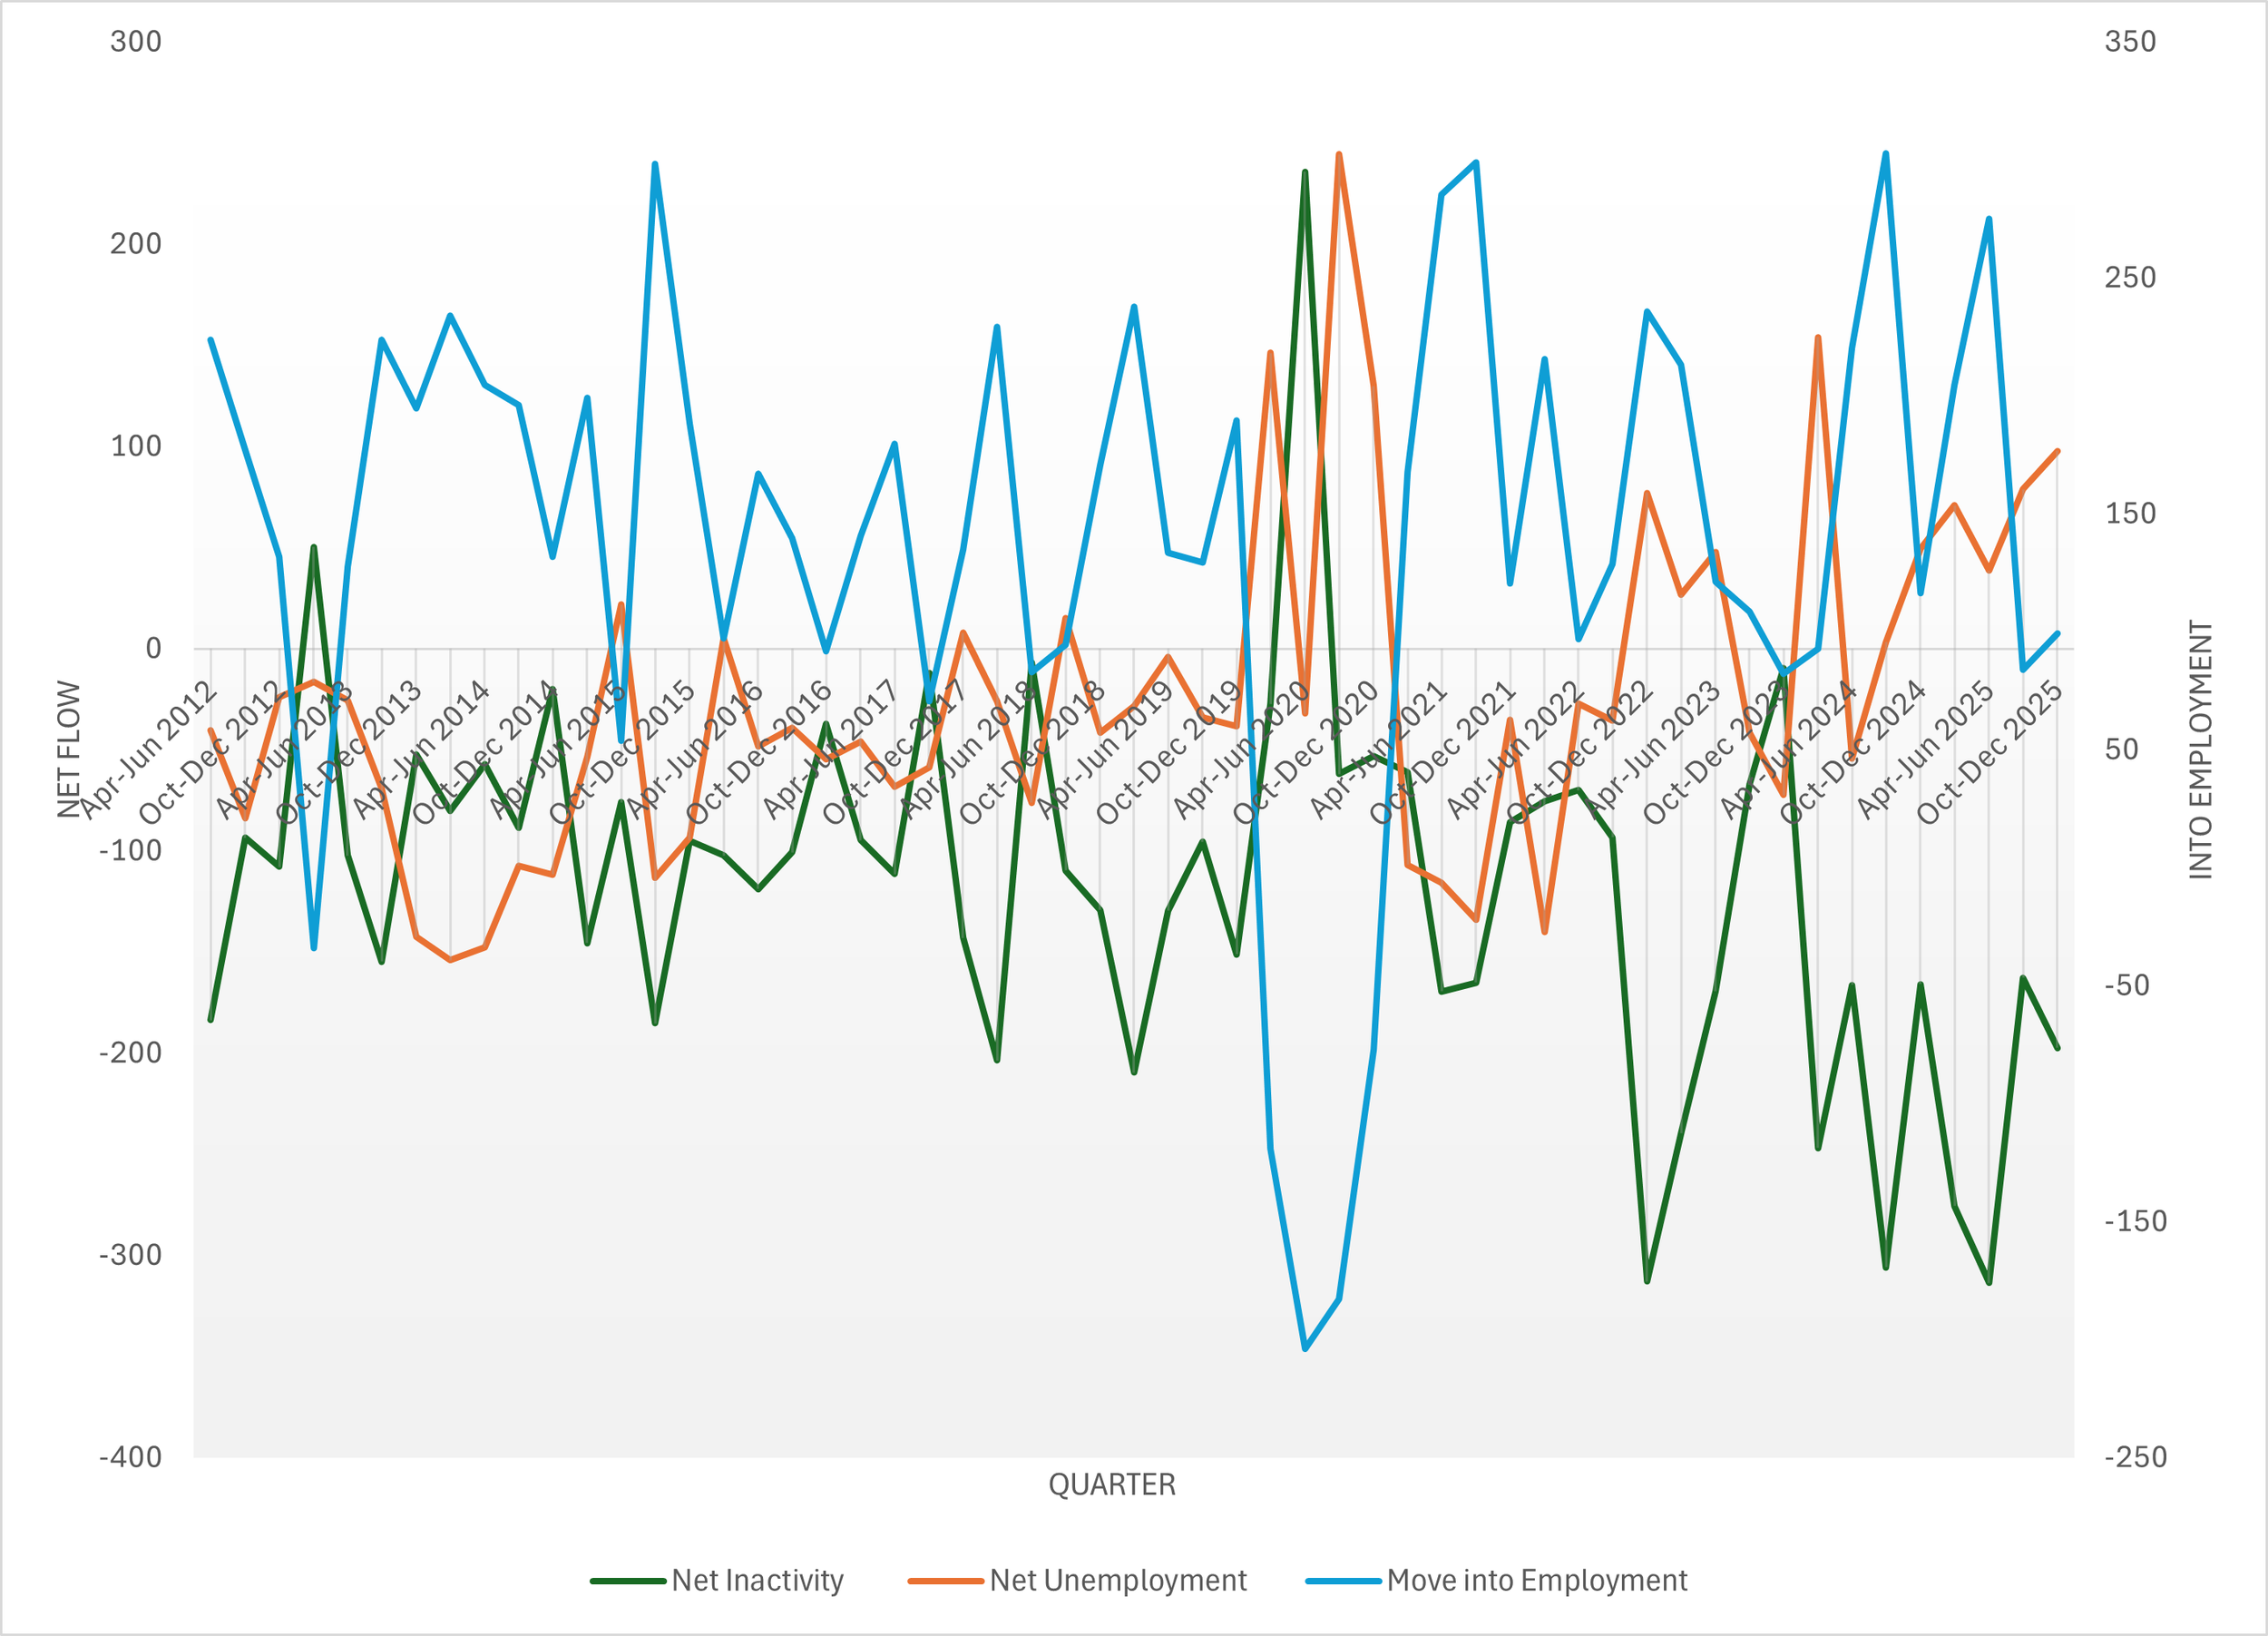
ONS numbers and authors calculations
Although the pattern may appear abstract, the underlying message is straightforward:
Historically, when more people move into work, unemployment and inactivity tend to fall.
But inactivity can fall while both employment and unemployment rise if previously inactive individuals become active but cannot secure a job immediately. This is some of the trend we can see in recent figures but also previously in 2017-2018, and 2015.
This is exactly the nuance missing from typical commentary. The flows of people from employment <> unemployment <> inactivity is a lot more complex than looking at a rising unemployment figure and assuming the worst.
2. Post‑2023 Flows
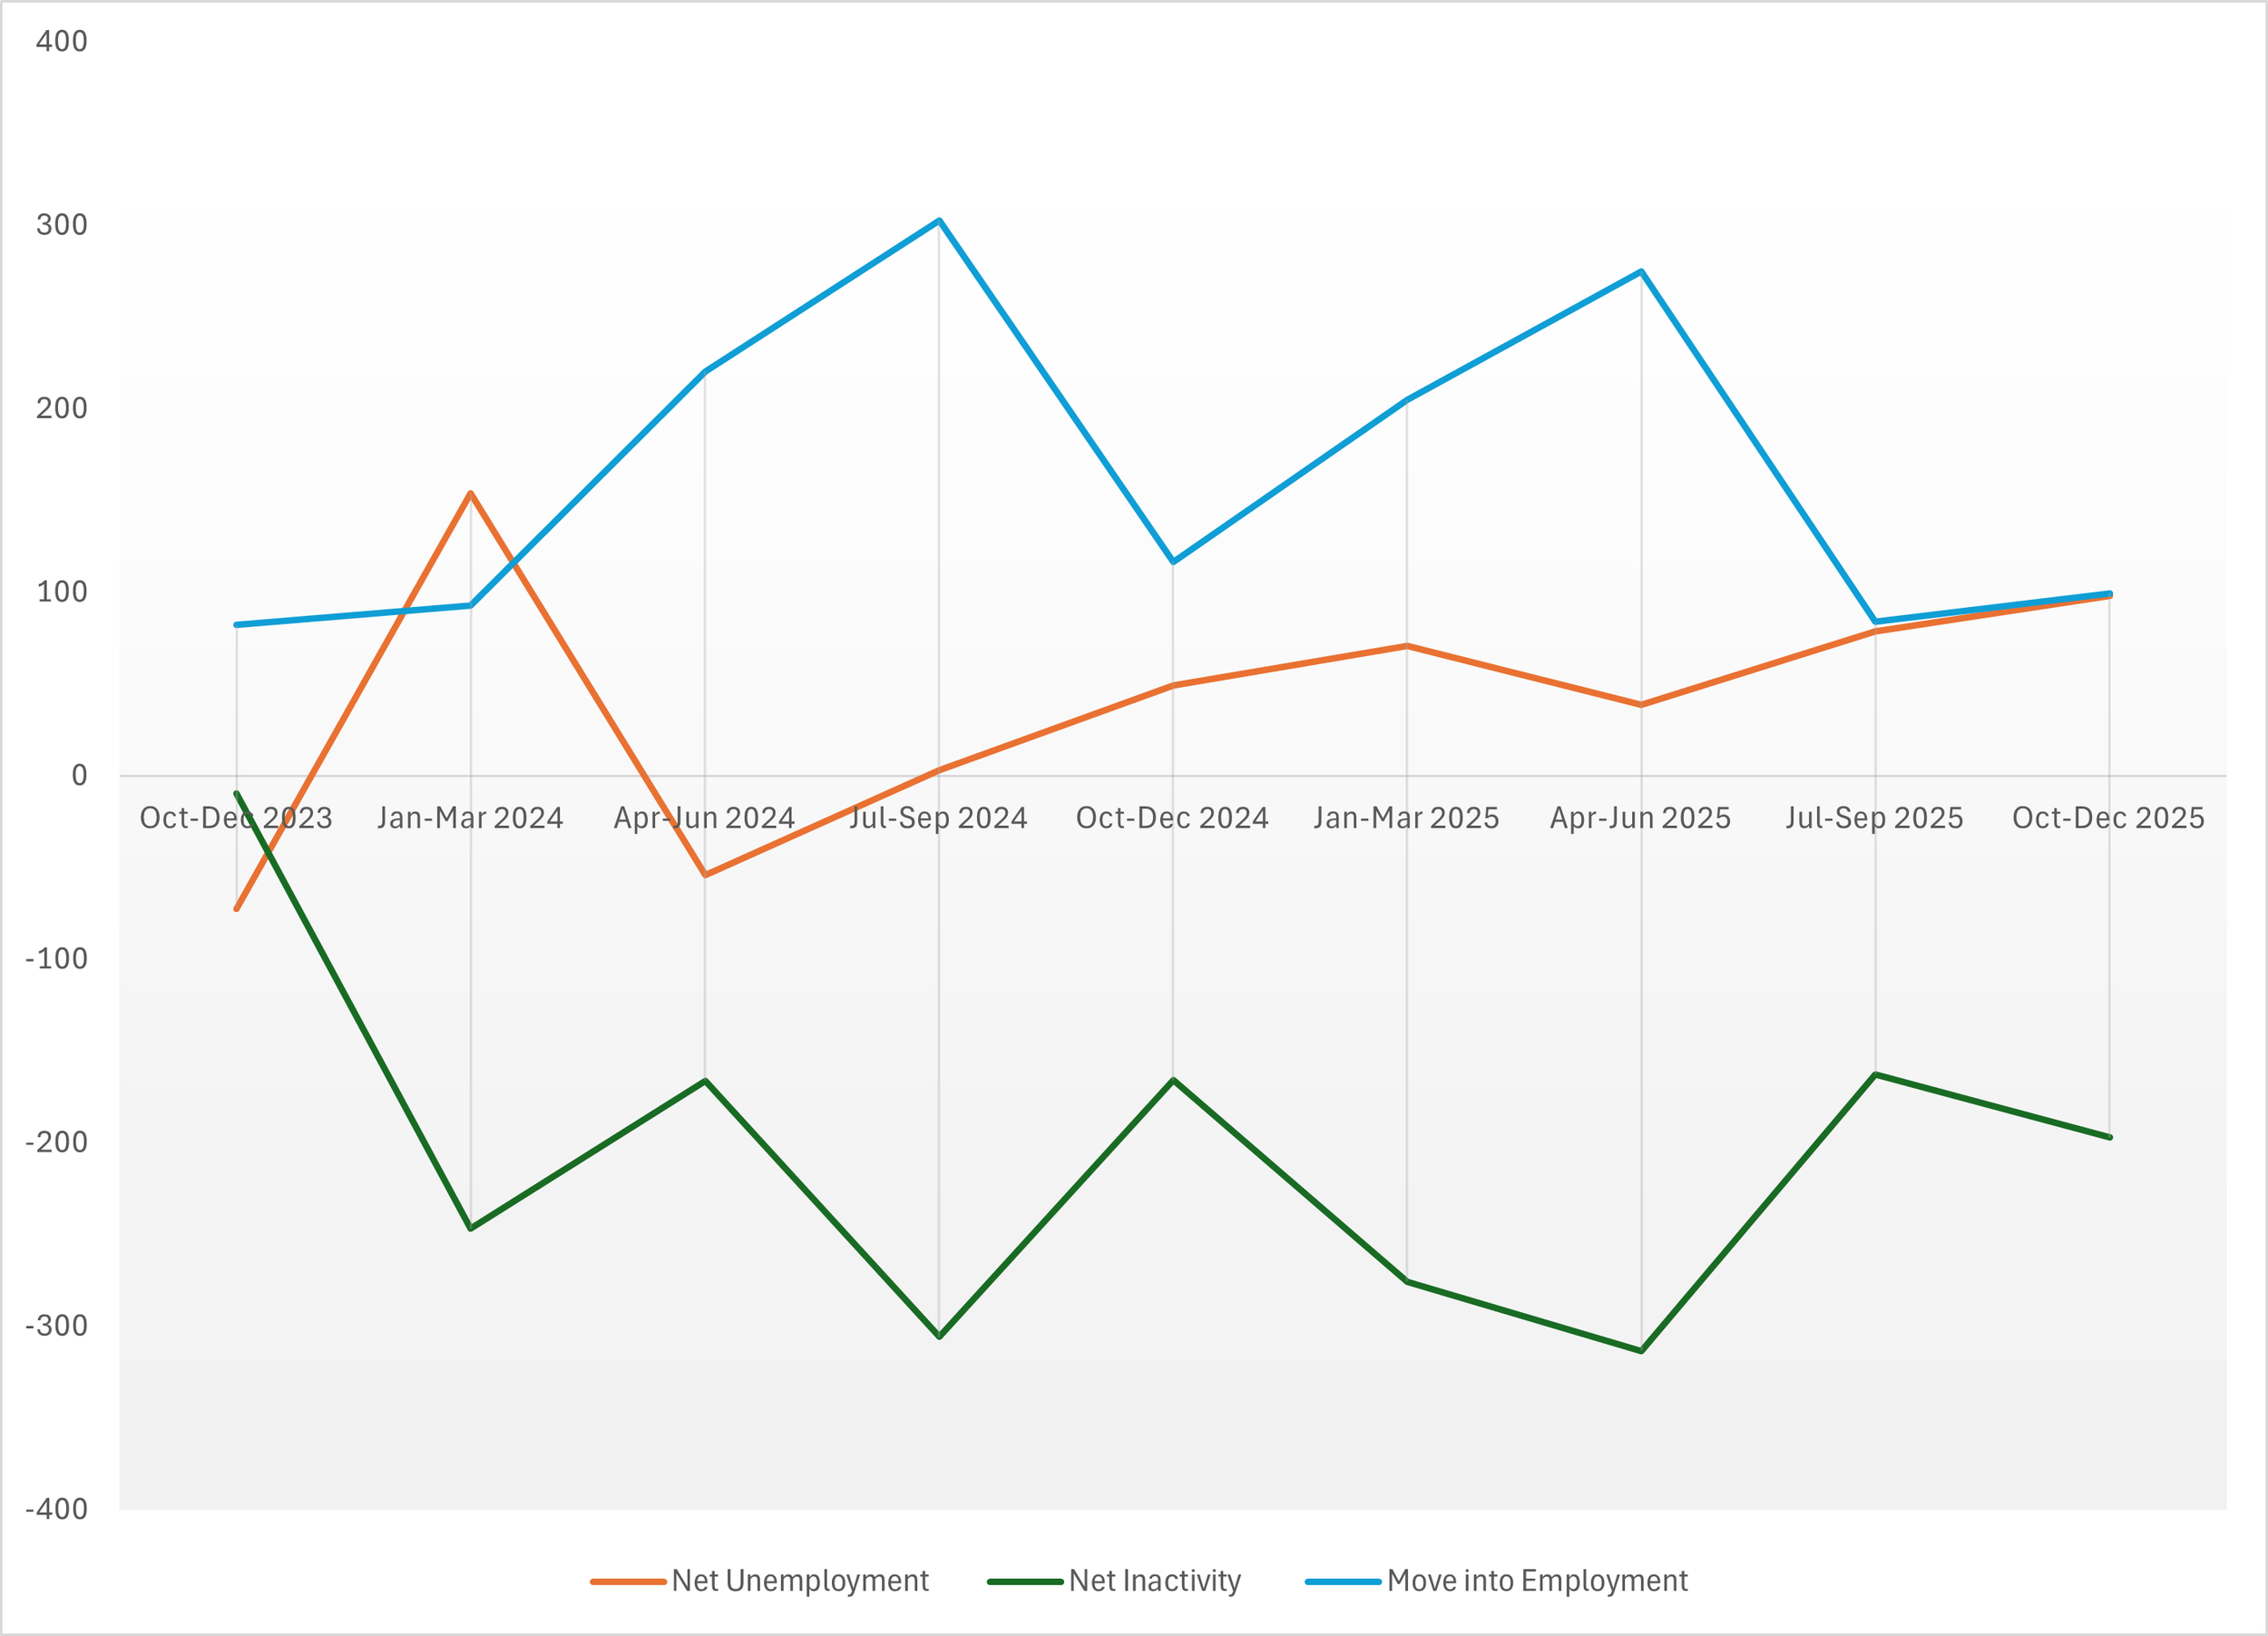
Analysis of LFS Labour Flow data with Authors calculations
Narrowing this down to more recent data, since 2023:
Unemployment has increased.
Employment has softened.
But inactivity has continued to decline.
The recent drop in inactivity (around 200,000 Oct/Dec 2025) broadly aligns with rises of ~100,000 in both employment and unemployment. This does not imply a 1:1 relationship, but it does highlight a more complex reality: Part of the rise in unemployment is driven by formerly inactive people re‑entering the labour force. But looking back we can see an increasing level of unemployment even as Inactivity continued to decline. Crucially, this will have two distinct effects that will increase unemployment:
It will increase competition for work - i.e. the number of applicants for each vacancy will increase
It will also increase the numbers of unemployed from groups which can often struggle to get work i.e. young-people, those with lower-skills sets.
So whilst we can broadly agree that increases in NICs and the minimum wage will increase the costs of hiring 16-24 relative to other workers, it is not the case that those increases costs of hiring have caused unemployment to increase. Rather, it is that there is too much labour being supplied relative to the number of jobs that can absorb them and the consequence is that younger workers have fewer opportunities to work.
Although the net outcome is more unemployment - it is more nuanced and should guard against us a rush to assume we need to implement some array of measures. In fact, unless we are in a position to reduce the costs of hiring for key groups, the main result is likely to be an increase in the very groups that normally suffer with higher rates of unemployment.
The 12‑Month Unemployment Challenge
None of this diminishes the fact that unemployment has risen. But the more important issue, as we have argued in other blogs, is duration.
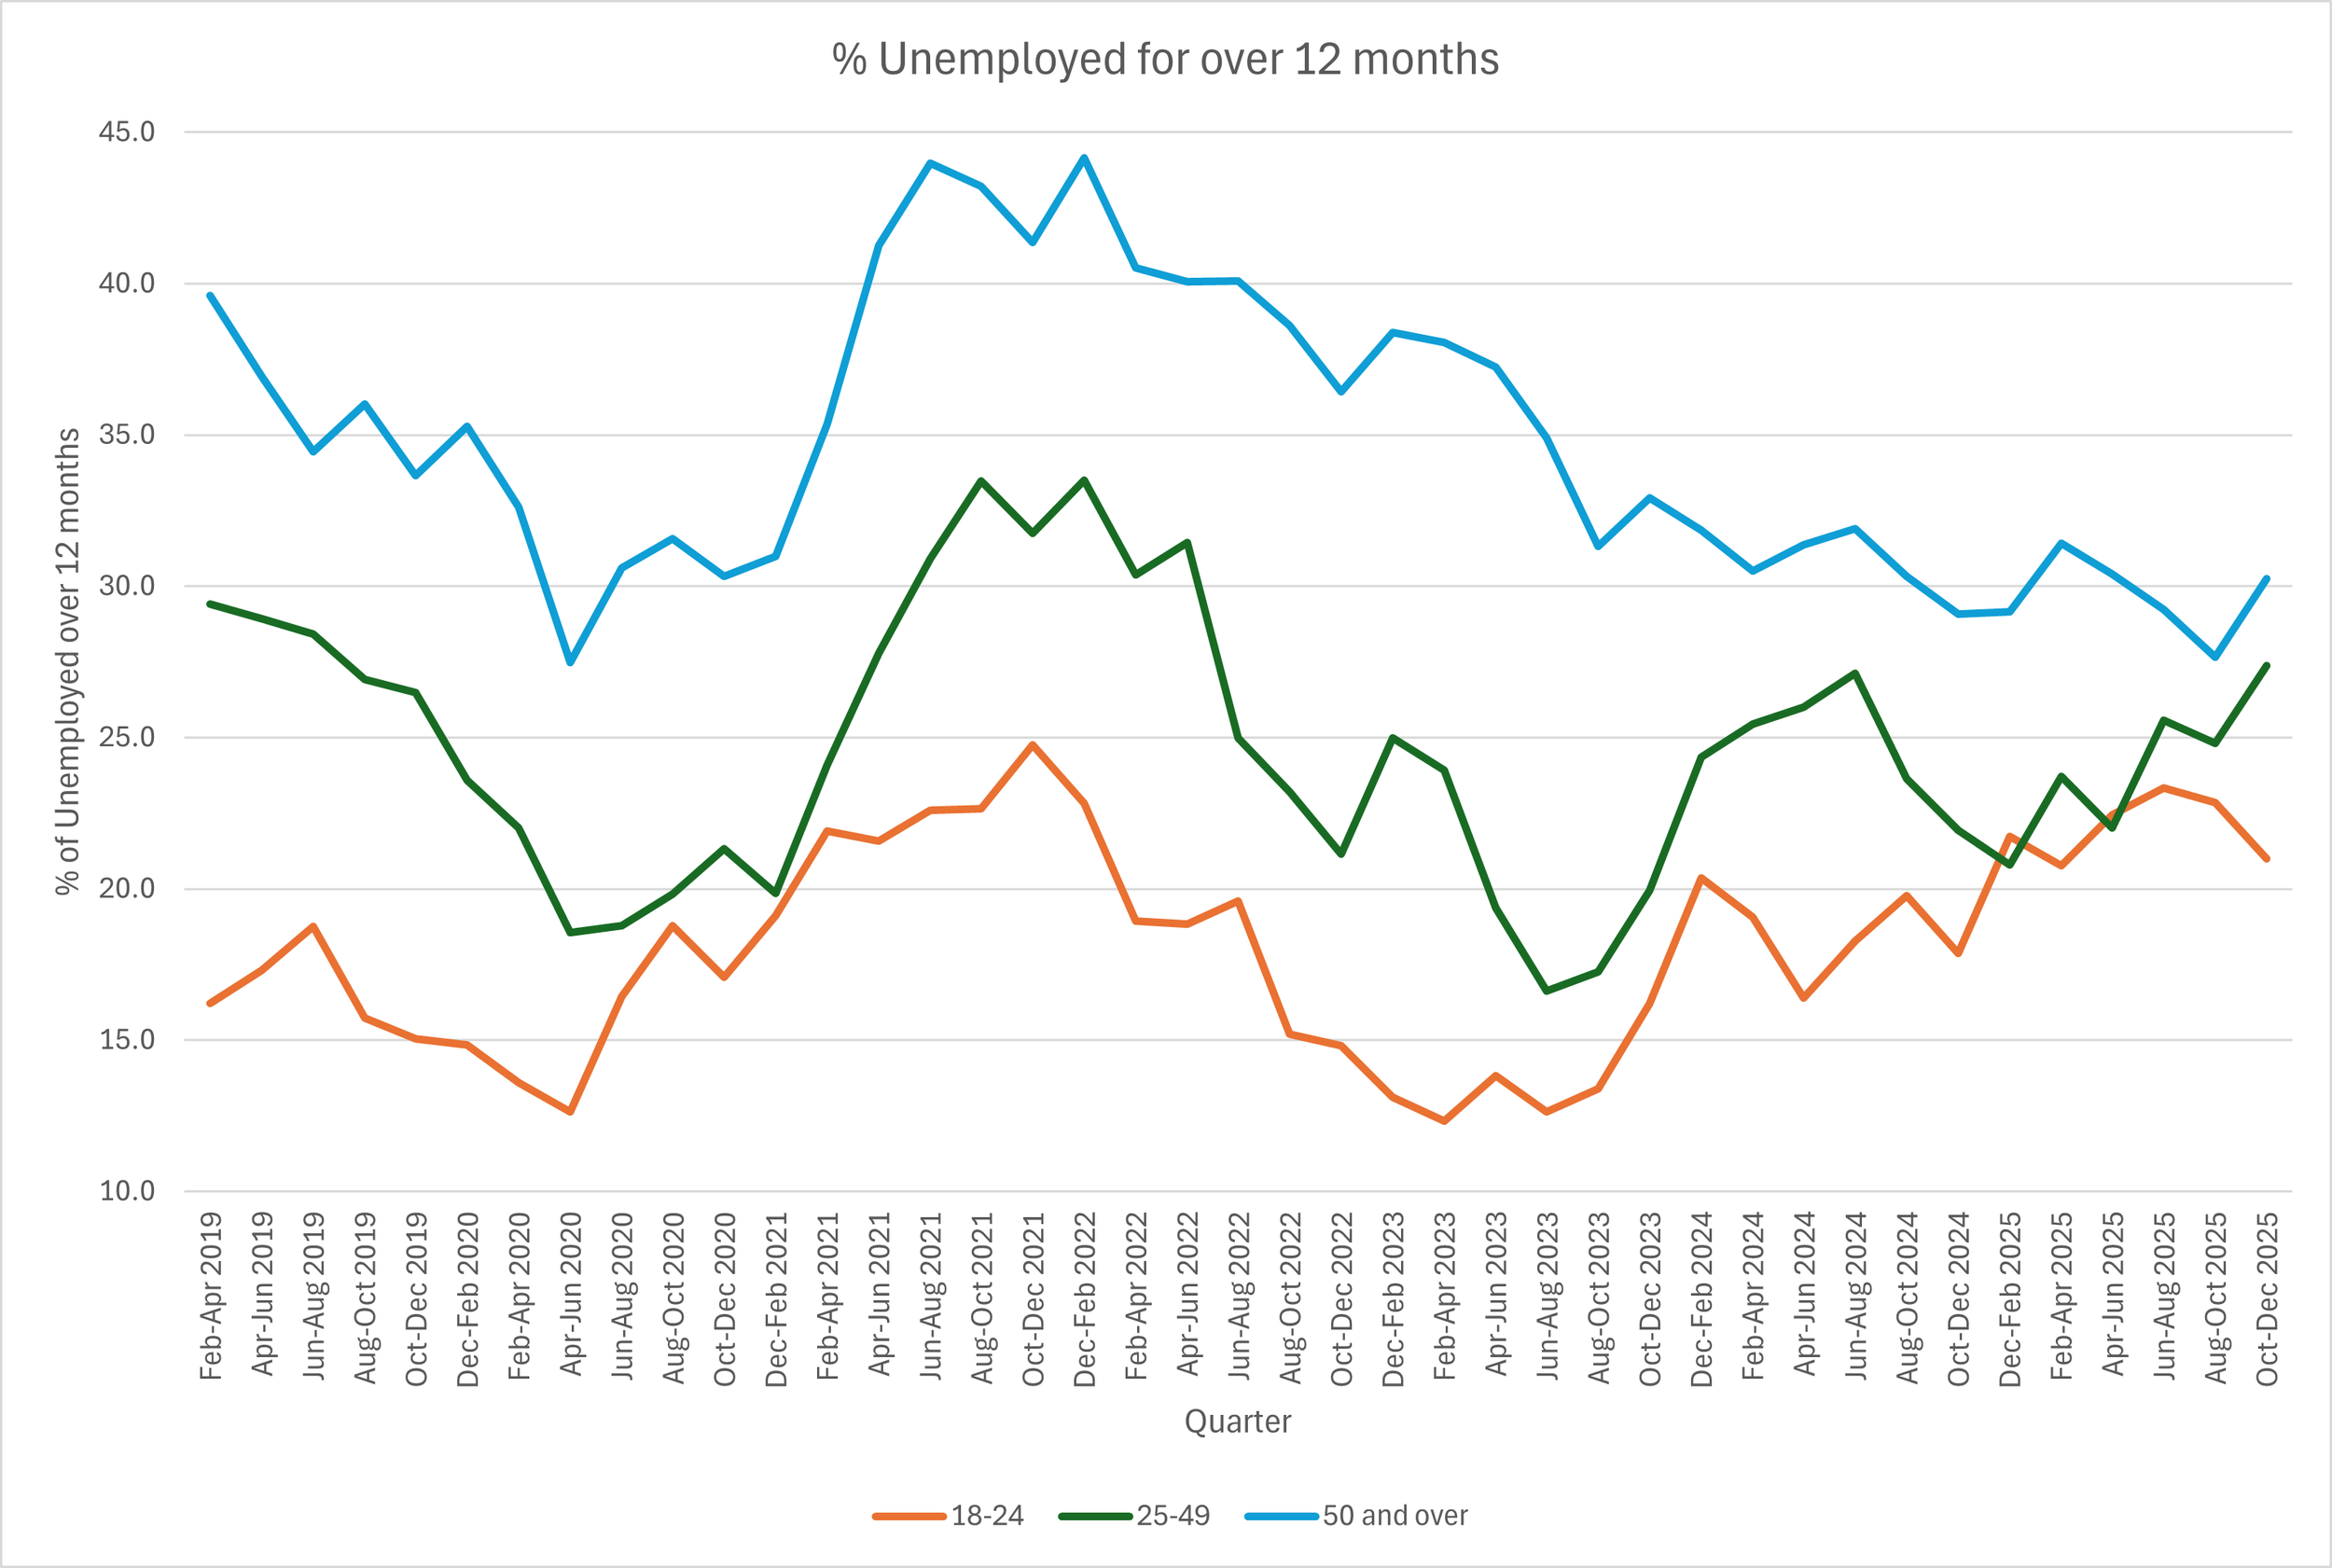
The chart above focuses on 12‑month unemployment for the three age groups. The recent increases for prime working age (25–49) and 50+ cohorts is concerning, as we can be reasonably sure that these figures will not necessarily be heavily impacted by declines in inactivity (although some workers may be affected). It suggests:
fewer suitable jobs available overall - so not just a decline in entry-level jobs for younger workers
rising risks of longer‑term detachment from the labour market
We would argue that the 12 months duration, these figures are a truer indicator of underlying labour market strain and are the key indicator about how serious unemployment is. At this stage, it still looks like a correction, a return to a more normal labour market but it needs to be watched.
Conclusion
Headline unemployment figures dominate debate, but they rarely capture the underlying story. When we look at the stocks and flows (how people move between states of work, inactivity, and unemployment) a more balanced picture emerges:
Rising unemployment is partly a return to long‑run norms.
It is also partly a result of labour market reactivation for some
And partly a reflection of economic slowing.
The deeper concern is not the level of unemployment but its duration, and whether individuals—particularly older and prime‑age workers—can access the right jobs in the right places at the right wages. This is where policy, employer behaviour, and investment conditions become central; and where the labour market lens must be complemented by a broader understanding of economic development.
One key thing is to remember something important - outside of major economic crises Unemployment is not cumulative. That means its not just about more and more people becoming unemployed with no hope of getting a job. Even the latest JP Morgan note that suggested that Unemployment could reach 6% also said that rates would reduce by the end of the year. It may seem odd to say that Unemployment rates do not matter, the more accurate thing is to say that the rates do not matter so long as the duration of unemployment does not keep increasing.